E-learning in analysis of genomic and proteomic data 2. Data analysis 2.2. Analysis of high-density genomic data 2.2.1. DNA microarrays 2.2.1.8. Analysis of arrayCGH
Recently, in many biological and medical experiments, the aim of the study is to compare the primary structure of two different DNAs, or more generally DNAs of two samples of interest. Such a comparison can be performed in species/subspecies comparative studies (and is of use in constructing phylogenetic trees), as genome changes are thought to play important evolutionary roles in speciation ([14], [5]). Even more important, DNA comparison is the primary tool in studies revealing the molecular mechanism of certain congenital or acquired diseases, especially studies of the complexity of tumors.
Genetic instability is one of the key factors in the process of cancerogenesis/neoplastic transformation of the cell ([8], [34]). Particularly chromosomal aberrations including deletions, amplifications, inversions, and translocations are the main mechanisms activating oncogenes or inactivating tumor suppressor genes, responsible for the control of the cell cycle, including proliferation and reparation processes.
The range of affected genetic information varies from one nucleotide (single nucleotide polymorphisms, abb. SNPs or single nucleotide changes), through smaller or wider chromosomal regions (copy number changes), to whole chromosomes or chromosome sets (aneuploidies).
The presence of these aberrations is closely related to and can have an important effect on gene expression ([17], [10]) and vice versa [9].
For different groups of tumors, specific chromosomal aberrations can be found. One of the well known examples are mutations present in BRCA1 or BRCA2 tumor suppressor genes, which were identified as important markers involved in many cases of hereditary breast and ovarian cancer. Women with certain BRCA1 or BRCA2 mutations have an increased risk of developing breast or ovarian cancer [50]. There exist a number of such genetic markers, some of which are of general importance and can be found in many types of cancer, others are rather tumor-specific. Thus revealing these changes is crucial for understanding the molecular mechanism of the disease and for finding specific therapeutic targets. Several techniques such as Comparative Genomic Hybridization (CGH), Representational Difference Analysis (RDA), Fluorescence in Situ Hybridization (FISH), and, more recently, the technique of arrayCGH, enables us to reveal such changes. The technique of arrayCGH is relatively new and a nowadays widely used technology for the identification of genome changes ([48], [38]). The main advantage of this technique is that, in comparison to other techniques, it allows to reveal chromosomal aberrations along the whole genome in just one experiment.
2.2.1.8.1. ArrayCGH principle
The technique arrayCGH is a special case of a microarray experiment.
The principle of the arrayCGH microarrays (see Figure 1) follows this scheme and is based on a Comparative Genomic Hybridization (abb. CGH) technique which compares the DNA from a test and a reference sample (e.g. tumor and healthy tissue). Each DNA is labeled by different fluorescent dye and then hybridized to an array with spotted immobilized DNA sequences of interest. DNAs from both samples competitively hybridize with probes on spots with complementary sequences. Microarray slides are then read by laser scanner, and the fluorescent intensities for both channels are captured, using specific filters creating microarray images. These images are then analyzed by special software which identifies signal fluorescent intensities for both channels, and converts them into numeric data. As already mentioned, signal fluorescent intensities of each spot from both samples are considered to be proportional to the amount of present genomic sequence respective to the spot. For the following analysis, a log ratio of base 2 (log2ratio) of the intensities in both channels is taken for each clone.
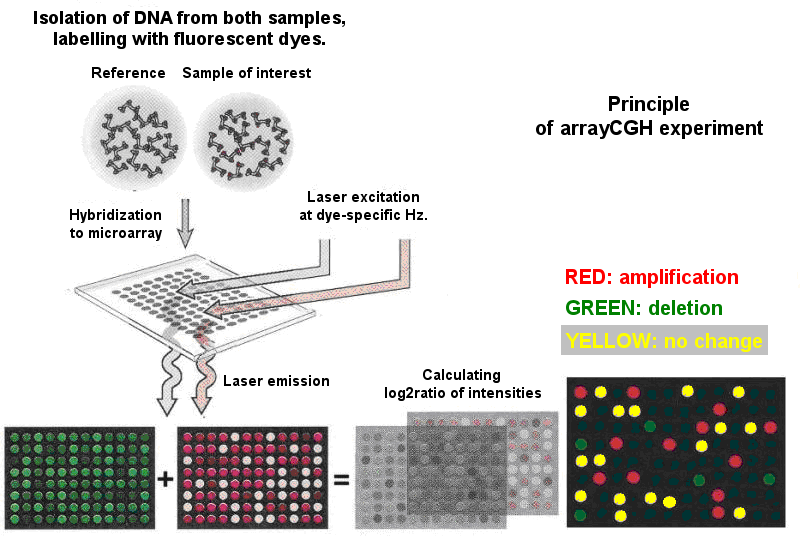
Fig. 1. The principle of an arrayCGH experiment. Based on http://www.mun.ca/biology/scarr/cDNA_microarray_Principle.jpg
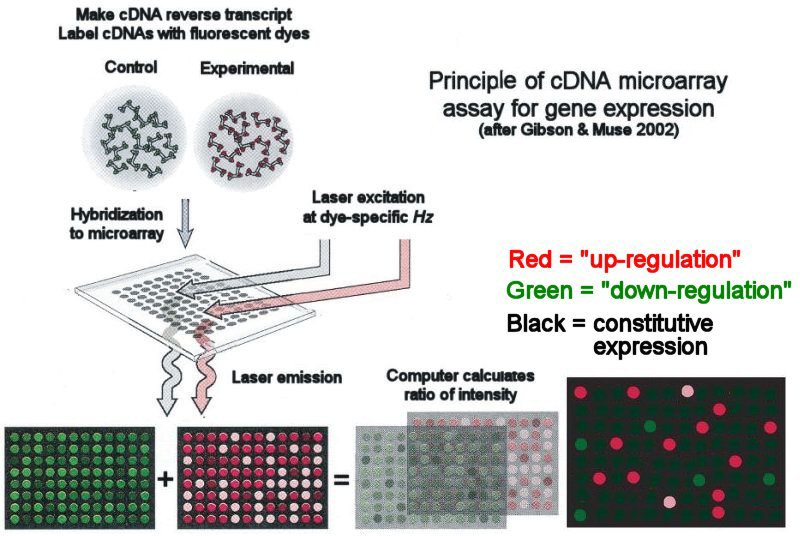
But microarray technology can be used for analysis not only the structure, but also the activity of the genome. This can be done both on mRNA (expression microarrays) and protein level (protein microarrays).
There are various sources of technical and biological variation that affect such an experiment. Technical variation is due to the preparation of the microarray slide as well as the process of hybridization itself, e.g. differences in efficiency of incorporation between different dyes, print-tip spatial effects, and intensity-dependent effects. Biological variation arises from heterogeneity of the cells in the inspected sample; a tumor sample for instance is almost always a mix of tumor and normal cells. Further there is also heterogeneity between the tumor cells because different parts of tumor reveal different stages of tumor progression (this heterogeneity can result in different chromosomal aberrations). All these sources of variation bias the data and introduce noise to the data. Before the data can be analyzed, they have to undergo pre-processing with the goal of removing as much technical variability as possible. This includes various filtering processes with respect to quality criteria and normalization requirements.
2.2.1.8.2. Analysing the data from arrayCGH experiments
Let us assume that the reference sample comes from normal cells, and that there are two alleles of a gene in a normal cell, a log2ratio equal to zero means that gene copy numbers of the test and the reference sample are equal. A log2ratio smaller than –1 indicates deletion (log21/2=-1) and a log2ratio larger than 0.58 points at an amplification of the gene in the test sample (log23/2=0.58).
As already mentioned, the main advantage of the technique of arrayCGH is that it makes it feasible to reveal chromosomal aberrations along the whole genome in just one experiment. However, this advantage can turn into a drawback when analyzing all results together. The simplest way to explore the results is to plot the log2ratios of all clones to their respective position on the genome. An example of such a plot is displayed in Fig. 2.
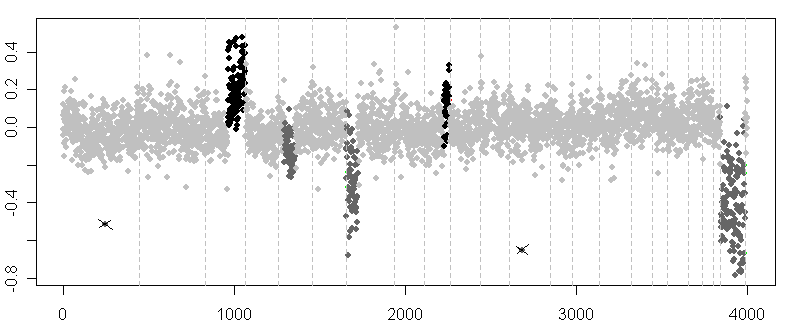
Figure 2. Graph of log2ratios of clones plotted to their respective position on the genome. The arrayCGH profile of a patient with Wilms tumor reveals several deleted (dark grey dots) and amplified (black dots) regions, with mean log2ratio biased towards zero. Two outliers are marked by crossed lines. Dashed vertical lines represent edges of chromosomes.
The figure displays an arrayCGH profile of a patient with Wilms tumor ([32], publicly available dataset). Apparently, the theoretical log2ratio values are biased towards zero. This is due to the above mentioned technical and, here, mainly biological variation of the tumor sample. Because of the large number of genes inspected and the noise in the data, a simple visual inspection of the above plot is insufficient for an objective analysis of aberrations. Moreover, as pointed out in [15], such an approach would be time consuming, prone to human error and its results non-reproducible.
A heurism for the detection of deleted and amplified regions is to apply threshold values derived from theoretical assumptions about the data and their log2ratios (ranging from -1 and 0.58). However, the presence of noise makes it hard to identify aberrations when using this approach. Different strategies that reduce the impact of noise were proposed (e.g. [38], [39]). For example, the one mentioned first derives thresholds from normal versus normal array, selecting those genes with extreme log2ratios. However, the main drawback of thresholding approaches persists; the simple placement of a threshold to detect changed genes can omit clones in altered regions of which the log2ratio is neither high nor small enough, due to too much variability. Moreover, some of these approaches need to carry out one or more normal/normal experiments.
For objective analysis of arrayCGH data, more sophisticated methods are in demand. When searching for copy number changes, we can take advantage of the information about rank-order dependence of the genes, in connection to their true position on the genome. Because aberrations usually affect wider chromosomal regions, it is reasonable to assume that neighboring genes are more likely to reveal the same aberration. Various papers using different approaches have been published on this topic so far. The majority of methods are based solely on the assumption of rank-order dependence. A most recent trend in such studies is to additionally consider the real positions of the genes on the genome for the sake of more accurate results. Some authors point out that there exists a substantial overlap between clones in the arrayCGH experiment and that this overlap concerns more than 30% of the size of the clone (Stejrnqvist et al., 2007). This would mean that the assumption of clone independence made for the majority of methods is violated. Another points of concern are the statistical significance of detected aberrated regions, estimation of the false discovery rate (FDR), and the classification of the regions into one of the three states: deleted, amplified, and non-aberrated (the latter will be referred to as normal), or even more precisely the number of copy changes (deletion of one up to all copies, single or multiple amplification of a copy). Last, but not least, the handling of outliers is one of the main interests in some of the proposed methods. Treating outliers as inliers can significantly affect the remaining points and the overall result of the analysis. Outliers (see Fig. 1) can have several causes. First, an outlier can be the result of measurement noise or mislabeling of clones. There is also the possibility that a single clone outlier corresponds to a known location of a copy number polymorphism (CNP). Finally, a single outlier could truly represent an aberrated region, rather rare indeed. Methods for arrayCGH analysis are described in detail in section II. In general, the majority of proposed methods assume that the data follow a Gaussian distribution, for which the mean (or sometimes even the standard deviation) can change along different copy number changes.
Four main concepts are characteristics for the majority of proposed methods: There are segmentation (also breakpoint detection) approaches, Hidden Markov Model (HMM) approaches, clustering approaches, and smoothing approaches. Although methods can be classified according to other, above mentioned concepts - such as implementing real distances, providing a classification, etc. - we will group them according to their dominating approach.
In next chapter, we will describe the main approaches for arrayCGH analysis in detail. Before, we will introduce some terminology used in arrayCGH analysis.
2.2.1.8.3. Terminology
So far we introduced the following terms: SNPs (single nucleotide polymorphisms) for one nucleotide change; amplifications, deletions or more generally copy number changes for the chromosomal aberrations denoting gains or losses of a gene copy in a chromosome; and aneuploidies denoting whole chromosome copy number changes. In the literature this terminology differs, usually according to the aim of the proposed method.
Some authors distinguish between copy number losses/gains (or similarly regions of losses/gains, amplifications/deletions), and use this terminology for all types of copy number changes, including aneuploidies. [3], [33], [53], [6], [21], [20], and [35] classify copy number changes according to the number of copies of a gene present: single and double deletions, single copy gains and higher level amplifications, but finally they build only three-state models: deleted, normal, amplified.
Some authors go beyond this division and consider also the size of aberrations. Myers et al. [30] uses the term aneuploidies for whole chromosome copy number changes and segmental aneuploidies for partial chromosomal changes. Fridlyand et al. [15] distinguish four main types of aberrations: copy number transitions, whole chromosomal gains and losses, focal aberrations, and high level focal amplifications. They point out that each type is initiated by a failure of a different molecular mechanism. Gains or losses of whole chromosomes are expected to occur as a failure of a process of division of nucleus or cell. The mechanism of copy number transitions (which stands for low level and wider copy number changes within the chromosome), focal aberrations (low level copy number changes of less than 1Mbp size within the chromosome), and high level local amplifications (high level focal copy number changes) is more likely to be initiated by double-stranded breaks of the DNA. According to Fridlyand it is believed that there is some kind of mechanistic difference between the breaks leading to focal aberrations and low level copy gains respectively losses.
Often used synonyms for copy number changes are also copy number alterations, copy number aberrations and copy number variations (CNVs).
In the following, we will restrict ourselves to the terms copy number changes / deletions / amplifications and aneuploidies, unless describing particular methods.