E-learning in analysis of genomic and proteomic data 2. Data analysis 2.1. General analysis workflow 2.1.2. Class comparison (searching for differences between classes) 2.1.2.2. Hypothesis testing
There exist a large number of statistical tests but we describe only the most commonly used. Methods for hypothesis testing which helps us to make a decision can be divided according to the number of groups we compare and whether the data follow some type of known statistical distribution. The last condition divides methods for statistical testing in two main groups - parametric and nonparametric methods.
Parametric methods assume that the data follow some type of known statistical distribution (Gaussian, Chi-square,...). This means we make some assumptions on parameters of this distribution (from here the name parametric methods). When the data does not fulfill the assumptions of a test, the result we obtain can be very misleading. Thus, it is very important to check the distribution assumptions before the test is applied.
Nonparametric methods make almost no-assumptions on parameters; these are distribution-free methods. These methods do not compute with the numeric values of variables but just with theirs ranks. This means that the data have to be ordinal (must have been ordered).
Clearly, the nonparametric methods can be applied on all types of ordinal data even when they fulfill the assumptions of some parametric methods. The parametric methods can be applied only on data fulfilling the assumptions on distribution. Generally, parametric methods are considered to have more statistical power than nonparametric methods. Statistical power is the ability of the test to claim no difference if there is no difference (to find true negative results). This is important in order to not have too many false positive results. For this reason it is recommended to use the parametric methods, if possible. Another difference is that they are based on sum of ranks in each sample and they test the equality of medians, not means like the parametric tests do. In other words, they test the chance of obtaining greater observations in one sample versus the other.
Next, we discuss the main parametric and nonparametric tests, which can be used for class comparison in genomic and proteomic data analysis, divided according to number of groups that are compared.
The selection of the statistical test is based on the number of groups we are going to compare and whether the expression profiles of genes through samples are normally distributed or not.
If the gene expressions are normally distributed, we can apply parametric tests, such as T-test or ANOVA. In case of non-normality, their non-parametric alternatives should be used, such as Mann-Whitney U test or Kruskal-Wallis test. These tests do not assume the normality of the data. From above mentioned tests, the T-test and Mann-Whitney U test are applied in the comparison of two groups, while ANOVA and Kruskal-Wallis test compare more than two groups.
Comparing two groups
Parametric tests
One of the simplest parametric tests is the one-sample t-test. The assumption is that measurements follow a normal distribution. It is constructed to compare sample group mean with a certain fixed value (with respect to the hypothesis). Before carrying out the test we have to check the assumption of normality. This assumption can be tested using e.g. Shapiro-Wilk’s or Kolmogorov-Smirnov test.
The statistic for one-sample t-test is given by
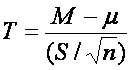
where M is the sample mean, µ is population mean (according to hypothesis), S is sample standard deviation and n is number of observations.
If we want to compare two groups, we use the already mentioned two-sample t-test, which is constructed to compare sample means between two groups. As well as in one-sample version, the assumption of normality has to be checked for both groups. Other assumptions are that the observations must be independent and standard deviations of groups must be equal (σ1 ~ σ2). The assumption on the equality of standard deviations can be checked by Leven’s test. The test statistic for two-sample t-test is given by
 ,
,
where  , where MC and MN are group means, SC and SN are group standard deviations and nC and nN are numbers of observations respective to cancer and normal group.
If the observations between groups are dependent, for example if they come from the same individual, the paired t-test should be used instead of two-sample t-test. For instance, when comparing the gene expression of patients before and after treatment or at the time of diagnosis and in relaps.
This test is based on samples of matched pairs and assumes that the differences between pairs are normally distributed. We can reduce paired t-test to one sample t-test testing the null hypothesis that the differences between two observations are zero. The test statistic is similar to the one-sample variation and is given by
 ,
,
where d0 is mean of differences between paired samples, Sd is standard deviation of the differences and n is the number of samples (! Please note, that this n is equal to number of samples, not the number of gene expression values, which is double as we have two values for each sample ( before & after treatment / diagnosis & relaps)!).
Nonparametric tests
Wilcoxon test, Mann-Whitney test
When the data does not come from normal distribution, we cannot anymore rely on parametric methods. So here come in handy nonparametric methods which do not assume data normality. As already mentioned, in comparison with parametric tests they are less powerful, rejecting false hypothesis with lower probability than parametric tests.
We will mention two basic nonparametric tests: two-sample Mann-Whitney test and its paired variant Wilcoxon test.
In two-sample Mann-Whitney test the situation is similar to two-sample t-test. We need two independent groups with comparable observations and of course the observations within each group have to be independent, too.
We test the null hypothesis that the two samples are drawn from the same population and therefore their probability distributions (unknown) are equal. The alternative hypothesis is that there are differences between two groups. Calculation of the test statistic U is easy. First of all, we assign each observation a rank within all observations (both groups together). Then we calculate the sum of ranks of all observations in the first group (let’s denote it R1), and equivalently the sum of ranks of all observations in the second group (R2). Then the test statistic are computed for each group and are given by
 , and equivalently
Then we compare min(U1, U2) with tabulated critical values for given n1, n2, and selected significance level. If min(U1, U2) is smaller than the tabulated critical value, we reject the null hypothesis and claim the difference between the two groups.
The Wilcoxon paired test is a nonparametric alternative for paired t-test. Like the paired t-test it is based on differences between measurements. Let’s denote Xi, Yi observations of sample i and then compute the difference between these observations Zi=Yi-Xi for i = 1,..., n for each sample. We order the differences and test the null hypothesis that the differences are symmetric about zero by test statistic defined as
 ,
,
where Ri is rank of subject i of ordered |Zi| values,  , where I(.) is indicator function and n is number of subjects.
Comparing multiple groups
Parametric methods
Analysis of variance (ANOVA)
When we have more than two groups to compare, we apply the analysis of variance, often abbreviated as ANOVA. It is a group of models and we distinguish three types of these models:
- fixed-effects model, in which we assume that the data come from normal distributions which may differ only in their means
- random effects model
- mixed effects model combining both fixed and random effects
There are different types of ANOVA depending on the number of treatments and the way they are applied to the subjects in the experiment we distinguish several types of ANOVA. Like One-way ANOVA, Two-way ANOVA or factorial ANOVA.
The theory of ANOVA models is better explained elsewhere, we let the reader to study one of these sources:
Following table can serve as a guide of selection the method for hypothesis testing according to type of data and comparison:
.png)