E-learning in analysis of genomic and proteomic data 2. Data analysis 2.2. Analysis of high-density genomic data 2.2.1. DNA microarrays 2.2.1.11. Pathway Analysis
2.2.1.11.4 Specific methods
In the previous section we discussed many of the general issues we face when performing a gene set analysis. Many of these issues require us to make a choice (will we use a competitive method? will we use a cut-off method?) and the combination of these choices leads to a wide range of potential analysis tools. In a recent review paper Huang et al. [2009] list 68 of such methods and even that list is not exhaustive. It is beyond the scope of this introductory text to cover all these methods but we will focus on a small selection of tools that will give the reader a flavour of different types of gene set analysis software.
2.2.1.11.4.1 TopGO
Like so many microarray analysis tools TopGO [Alexa et al., 2006] is an R-library available from the Bioconductor project. As the name indicates the programs analyses GO terms. The two principle statistical test TopGO offers are ones we discussed before: Fisher’s exact test and the competitive Kolmogorov-Smirnov Test. The innovative feature of the program is that it takes the hierarchical structure of the GO database into account. When a child term (e.g. "accute inflammatory response") is highly significant this will usually automatically make its parent nodes (e.g. ”inflammatory response”) significant too and thus causes redundant results. TopGO offers a ”bottom-up” analysis approach where genes from significant child terms are eliminated in the analysis of their parents, e.g. inflammatory response would only become significant if also genes that are not already involved in the accute child term are sufficiently differentially expressed. Additionally to its analysis features TopGO also allows a graphical representation of the most significant GO terms in a colour-coded tree.
2.2.1.11.4.2 Gene Set Enrichment Analysis (GSEA)
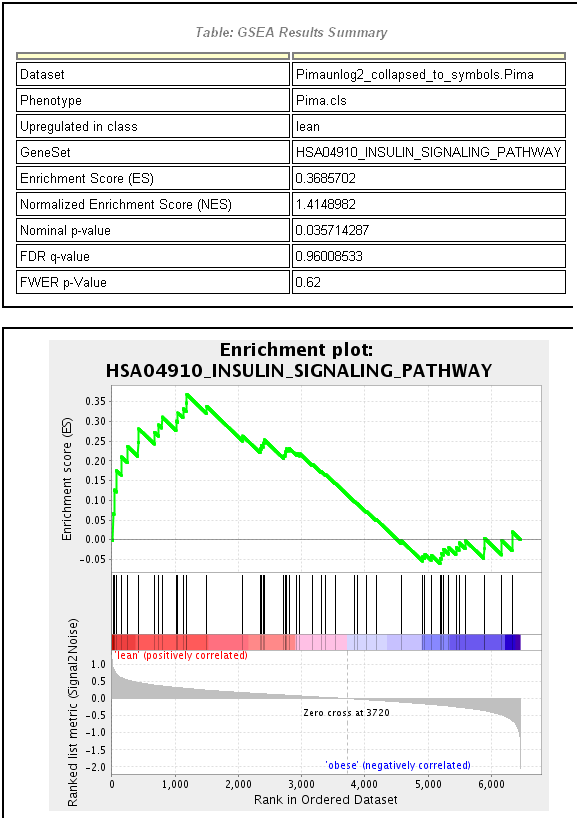
Gene Set Enrichment Analysis (GSEA) Subramanian et al. [2005] has become a very popular tool in recent years. Together with the MSig data base it was developed by the Broad Institute It is available as a stand-alone analysis program, but can also be accessed in different ways (e.g. within R). The core of the original GSEA algorithm is a slighly modified version of the competitive Kolmogov-Smirnov test. The corresponding test statistic is called an ”enrichment score” in GSEA terminology. Instead of basing the analysis on p-values GSEA also allows to use other data summary values (t-statistics, foldchanges, signal to noise ratios) to rank genes. For p-value calculation it offers both array and gene resampling as options. In figure 2.2.1.11.6 we see the GSEA output for the most significant gene set of class C2 (curated gene sets from online pathway data bases) in MSigDB. It is the insulin signal pathway, a very plausible result as the obese Pima Indians tend to suffer from type2 Diabetes, a disease that is caused by defect of this pathway. The graph in the output is similar to the type of plot in Figure 2.2.1.11.5(b) but rotated for 45 degrees.
Figure 2.2.1.11.6: GSEA output for the human insulin signaling pathway
2.2.1.11.4.3 GenMAPP and PathVisio
Whereas programs like TopGO and GSEA focus on analysing gene sets and offer own developed algorithms for this purpose GenMapp [Salomonis et al.,2007] and PathVisio [van Iersel et al., 2008] are mainly pathway visualisation tools. Both projects work together on collecting pathway maps, that can than be connected to microarray data. PathVisio is closely connected to the WikiPathways project and similarly to GenMapp it allows to colour code a pathway map like the one given in Figure 2.2.1.11.3 according to microarray data. For example one might choose to have all significant genes with a foldchange higher than 1.5 to be highlighted in red, which gives an immediate overview on which components of the pathway are differentially expressed. Both programs also include some analysis options, mainly modifications of Fisher’s test.
2.2.1.11.4.4 More statistically oriented tools
The last two examples we would like to give are more sophisticated statisticalmethods. The Global Test was first introduced by Goeman et al. [2004]. In contrast to most methods we discussed before it does not use a data summary like a p-value as input but uses all expression values of the genes in the gene set. Another unusual feature is that it reverses the usual role of explanatory variables and response. All other methods we discussed so far tried to explain gene expression by the two groups (e.g. lean and obese). The Global Test tries to explain the groups by gene expression, i.e. in this two group situation this is similar to a logistic regression model with the difference that the test does not give p-values for individual genes but scores the whole gene set. In contrast to the methods discussed before this method can also deal with other more complex designs than a simple two group comparison, e.g. it can be used to associate gene sets with survival times in a clinical study. A comparably flexible tool is Global ANCOVA introduced by Mansmann and Meister [2005]. Again this program makes use of the original expression values and does not use data summaries. The main difference to the Global Test is that this method uses the classical set up to regard gene expression as the response, which is explained by the design of the experiment. Both of these tools are available within Bioconductor in the libraries globaltest and GlobalAncova.