E-learning in analysis of genomic and proteomic data 2. Data analysis 2.2. Analysis of high-density genomic data 2.2.1. DNA microarrays 2.2.1.11. Pathway Analysis
2.2.1.11.2. Pathway and Gene Set Resources
Sharing information on the internet is an essential cornerstone of Bioinformatics. Sequence and Protein databases are the oldest and most popular of such resources and give very detailed information about single genes and proteins. The databases we are discussing in this section look into the opposite direction: they imbed genes in a more general context, give groups and categories of genes that have something in common.
2.2.1.11.2.1 The gene ontology database
At the heart of the Gene Ontology (GO) project [Consortium, 2004] is a controlled vocabulary ontology), which is given by so called GO Terms. These terms are subdivided into three principle categories: cellular component, biological process and molecular function. These three terms form the top nodes of a hierarchical data base, which can be accessed at http://amigo.geneontology.org/cgi-bin/amigo/go.cgi. Each GO term in the database can have parent nodes (more general terms) and child nodes (more specific terms). If we search for "inflammation" in the GO database we find that the correct term is ”inflammatory response” and has the identifier ”GO: 0006954” (Figure 2.2.1.11.1). Going up the hierarchy we see that this term has ”biological process" as top parent node and ”response to wounding” and ”defense response” as two direct parents, whereas the only direct child node is ”acute inflammatory response”.
Figure 2.2.1.11.1 Screenshot of the GO database search for ”inflammation”
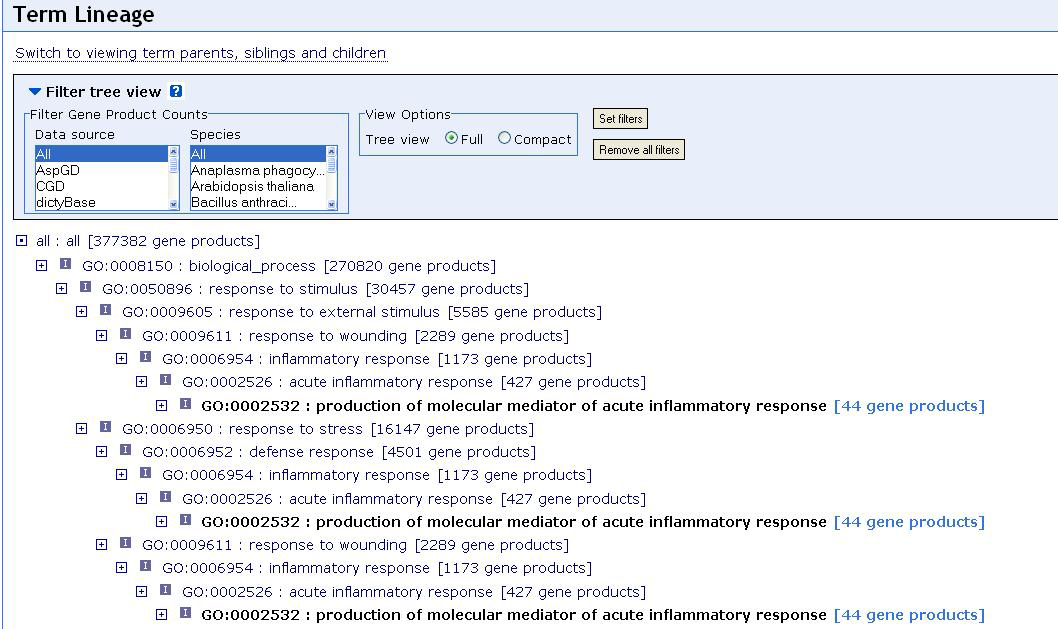
We can also see that 1173 gene products correspond to this term, which seems a very high number. But it should be kept in mind, that the GO database is not specifically designed for one organism only but tries to capture biological knowledge at a very general level. A gene that is involved in inflammation of mice, rats, humans etc. will thus be counted several times. It is also worth noticing that gene products can be both genes or proteins. Using for example the Bioconductor package annotate it is possible to identify all the probesets on an Affymetrix array that correspond to a certain GO term. In our example of the HGu95e-Array and the term inflammation we found 96 genes on the array, i.e. only a small fraction of 1173 gene products. It should be noted that like other online resources the GO database is ever changing. Even by the time from the first draft of this article the numbers we give here have already changed and they will certainly have changed yet again by the time a reader of this article will try to reproduce our search.
2.2.1.11.2.2 The KEGG pathway data base
Although the GO database is very informative and widely used in microarray analysis its universal approach also means that it can not capture more specific biological knowledge. Biological pathways are a concept that tries to describe biological mechanisms in a far more detailed manner. A pathway does not only give a list of genes corresponding to a biological process, but it also details the interactions between genes in the cell in a graphical ways. This type of pathway is often also called a signaling pathway or a gene regulatory network. The word pathway on the other hand is also used to describe interactions between metabolites (metabolic pathways) or protein (protein pathways), which can sometimes lead to some confusion.
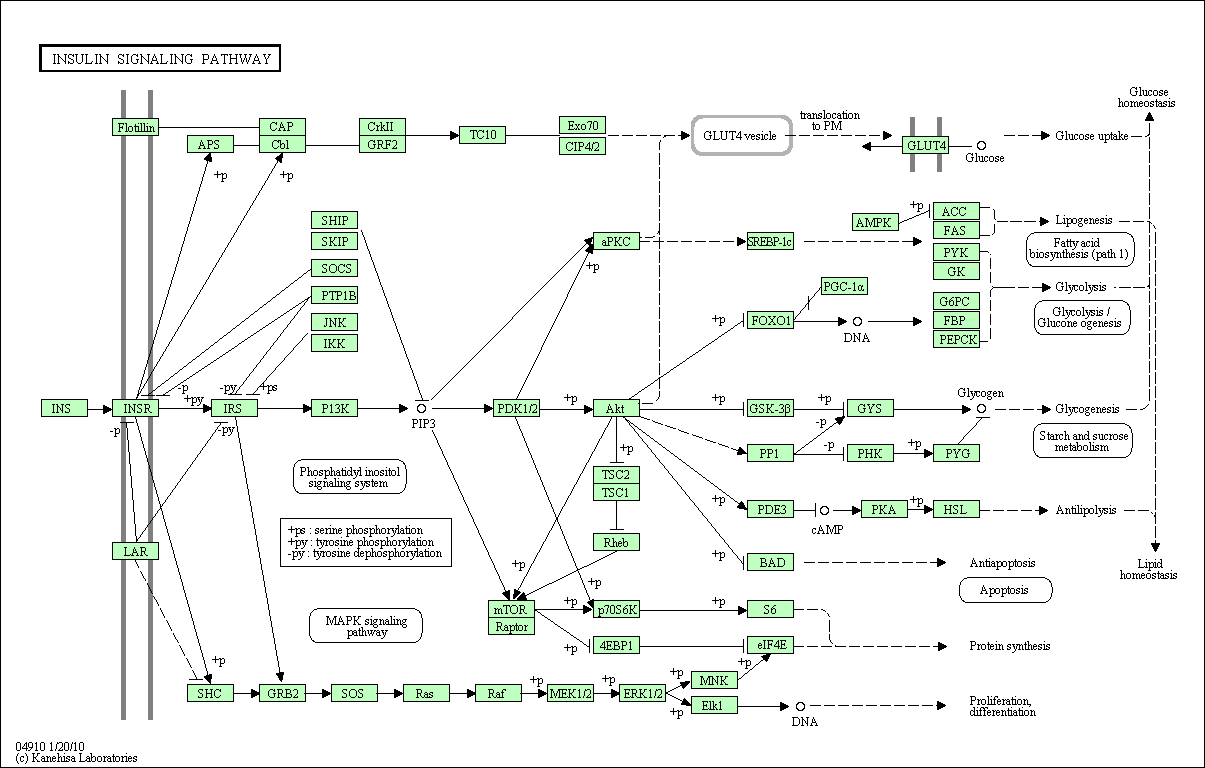
The Kyoto Encyclopedia of Genes and Genomes (KEGG) is a project that, among other things, provides access to a pathway database at http://www.genome.jp/kegg/pathway.html [Ogata et al., 1999]. In contrast to GO the information obtained from KEGG is organism specific and more detailed. In Figure 2 we show an example the pathway map of the human insulin signaling pathway. It does not only display the genes involved but by including arrows it visualises the cascade of regulation in the cell. It should be noted though that the symbols shown in the map are not always genes but often the proteins they code for or a whole gene group. For example see that the gene INSR (insulin receptor) regulates a box called SHC . If we click on this box, we see that actually this box represents a group of related genesnamed SHC1-SHC4.
Again there are Bioconductor tools (e.g. the library KEGG.db) that allow to access this database from within R. Most analysis tools though do not make any use of the structure of the pathway but only utilize the the list of genes contained in the pathways. In these types of analyses a pathway is not very different from a GO term, when it comes to the statistical analysis: both define a gene set.
Figure 2.2.1.11.2: The insulin signaling pathway as shown in the KEGG database
2.2.1.11.2.3 Wikipathways
Like all curated databases KEGG has the problem of staying up to date with the ever evolving biological knowledge in the literature and other databases. The Wikipathways project [Pico et al., 2008] tries to address this problem by
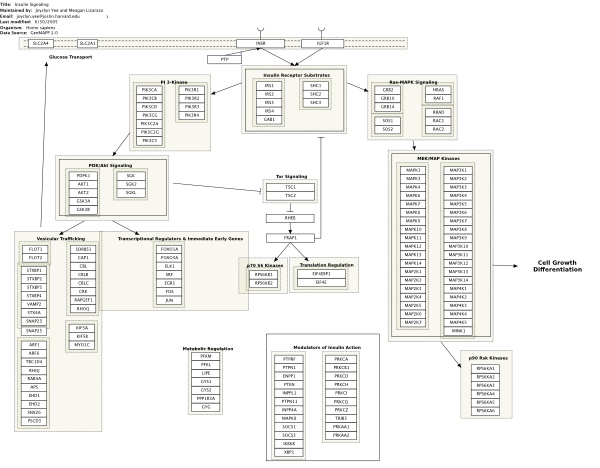
using a Wikipedia-like dynamic access to its content. By simply going to the webpage http://www.wikipathways.org any biologist can contribute new pathways or edit existing ones within this database. The aim is to converge towards pathway definitions that are generally accepted by the scientific community. In Figure 2.2.1.11.3 we see the WikiPathway presentation of the insulin signaling pathway. As we see the display is simpler than in the KEGG pathway map, which on the other hand makes this format easier to edit. There are no Bioconductor tools linking to Wikipathways but it is possible to download all existing pathways in various formats.
Figure 2.2.1.11.3: The insulin signaling pathway as shown in WikiPathways
2.2.1.11.2.4 The Molecular Signature Database (MSigDB)
As we said before the GO database and pathway databases like KEGG or Wikipathways are based on conceptually very different formulations of biological knowledge, but from an analysis point of view they lead to the same question: how can we decide whether the list of genes corresponding to the pathway or GO term is differentially expressed? The Molecular Signature Database (MSigDB) [Subramanian et al., 2007] takes this into account and uses the more general concept of gene sets. These gene sets are sub-divided into five general classes (C1-C5):
- C1: Positional Gene Sets for each human chromosome and each cytogenetic band.
- C2: Curated gene sets from online pathway data bases, publications in PubMed, and knowledge of domain experts.
- C3: Motif gene sets based on conserved cis-regulatory motifs from a comparative analysis
- C4: Computational gene sets defined by expression neighborhoods centered on 380 cancer-associated genes
- C5: GO gene sets consist of genes annotated by the same GO term
We see that although our previously considerd types of gene sets appear in C2 and C5, MSigDB takes a much broader view towards what might define a gene set of interest.