E-learning in analysis of genomic and proteomic data 2. Data analysis 2.3. Analysis of high-density proteomic data 2.3.2. MASS spectrometry 2.3.2.1. Introduction
2.3.2.1.1 What is proteomics?
Proteins are compounds formed by a chain of amino acids in a three-dimensional structure which carry out biological functions. The sequence of amino acids is determined by the DNA via transcription into messenger RNA. The proteome is the total protein complement expressed by a cell, and proteomics is the study of proteomes.
There are several factors that differentiate proteomics from the study of inherited genetic variation. In particular protein expression is cell-specific and time-specific, and so may vary within an individual.
There are many steps from inherited DNA to disease, including transcription to RNA, translation to proteins and post-translational modifications. One of the motivations for studying the proteome in a clinical setting is that this is in some sense closer to the disease process.
2.3.2.1.2 Mass spectrometry
Mass spectrometry (MS) can be used to characterise the proteome when applied to the appropriate biological sample (plasma, serum, etc.). Many experimental pre-processing steps are applied prior to MS, including depletion of abundant proteins which would otherwise dominate the profile, fractionation, digestion and separation, and these are not discussed further here. Various types of MS analyzer are in use; the focus here is on MS based on time-of-flight (TOF), in particular Matrix-assisted laser desorption-ionisation (MALDI)-TOF and Surface-enhanced laser desorption-ionisation (SELDI)-TOF. The biological sample is applied to a chip. MALDI uses an energy-absorbing matrix which facilitates ionisation without much fragmentation. SELDI is similar in principle to MALDI, but the chips are pre-coated with a special chromatographic surface so that different proteins bind to the surface depending on their chemical properties and that of the chip.
MS exploits the fact that molecules (including peptides and proteins) have different masses. Upon application of an accelerating voltage, the ionised molecules travel down the length of the MS instrument to a “detector” that measures TOF and abundance, and the time taken depends on their mass, or more precisely their mass-to-charge (m/z) ratio. Time-of-flight can be converted to the m/z scale measured in Daltons. The typical range considered is 2000 to 50000 Daltons, since at lower ranges there is generally too much noise, although this is machine-dependent and performance is constantly improving.
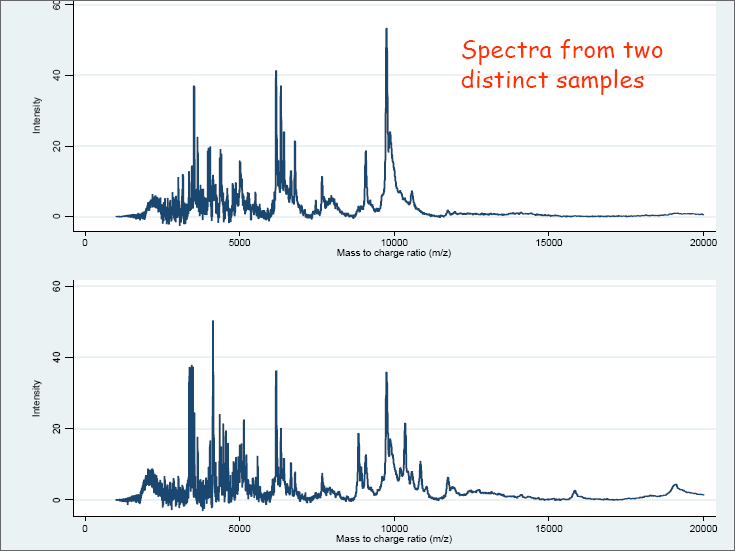
Applying MS to a biological sample to measure the proteomic profile results in a series of data points (x, y) in two dimensions, where x is the m/z value and y is a measure of abundance. Further analysis can be carried out leading to the identification of the proteins corresponding to the m/z values. However in many cases the identities of the corresponding proteins are unknown, and the profiles themselves are used to discriminate between different groups of biological samples. The focus here is on the analysis of such data in a “label-free” context, and the important step of identifying the peptides and proteins will not be covered. Examples of the resulting spectra can be seen in the accompanying slides (Figure 2.3.2.1 and Figure 2.3.2.2).
Figure 2.3.2.1 Example of spectra from two duplicate samples
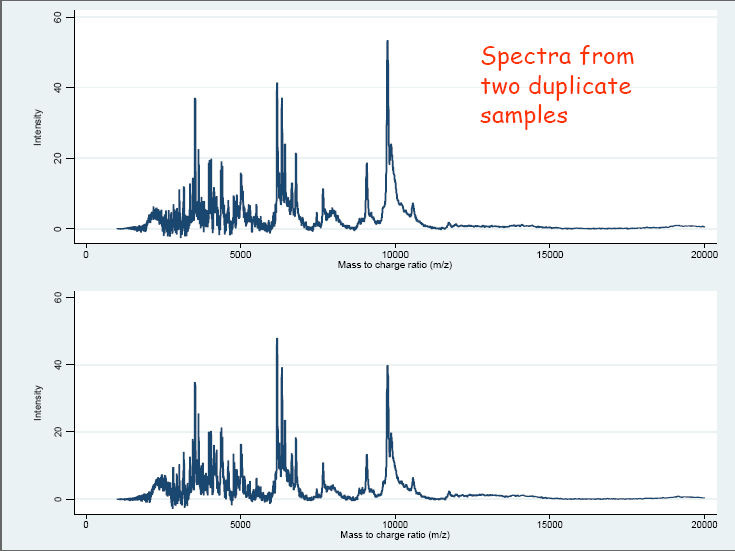
Figure 2.3.2.2 Example of spectra from two distinct samples